
Tampa Bay’s office market is sending a mixed signal this quarter. On the surface, net absorption came in at -71,800 SF for Q2 2026, a headline number that looks discouraging. But look under the hood and the story is more nuanced: Westshore and Downtown Tampa CBD both posted positive absorption, while it was Class B suburban properties that drove the bulk of the losses. Here’s everything you need to know about where the Tampa Bay office market stands right now, and what it means whether you’re a tenant, a landlord, or just watching the market.
Tampa Bay Office Market at a Glance (Q2 2026)

How Q2 2026 Compares to Recent Quarters
| Q2 2026 | Q1 2026 | Q2 2025 | |
| Total Inventory (SF) | 63,068,251 | 63,068,251 | 63,068,251 |
| Net Absorption (SF) | -47,726 | +19,724 | +293,768 |
| Overall Vacancy | 15.3% | 16.0% | 15.4% |
| Under Construction (SF) | 94,130 | 94,130 | 94,130 |
| Overall Asking Rate (FS) | $30.76 | $31.30 | $30.75 |
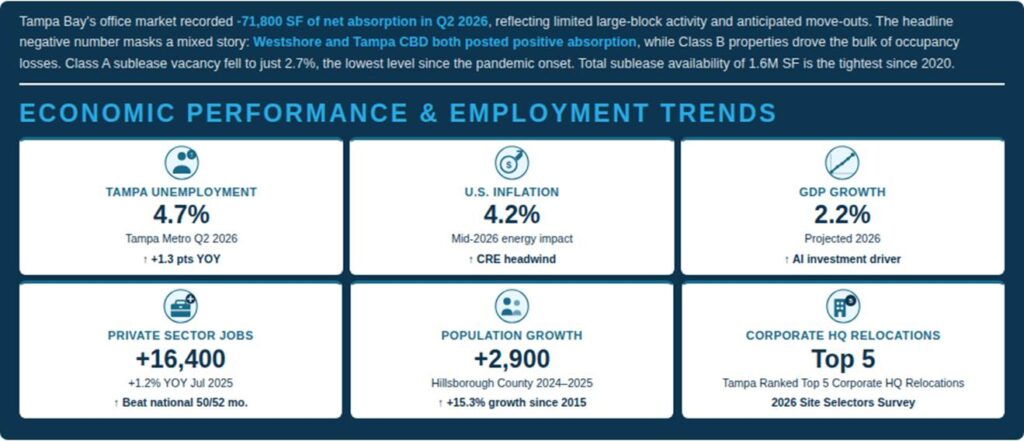
Tampa Bay’s office market recorded -71,800 SF of net absorption in Q2 2026, reflecting limited large-block activity and anticipated move-outs. The headline negative number masks a mixed story: Westshore and Tampa CBD both posted positive absorption, while Class B properties drove the bulk of occupancy losses. Class A sublease vacancy fell to just 2.7%, the lowest level since the pandemic onset. Total sublease availability of 1.6M SF is the tightest since 2020.
The Economic Backdrop
A few outside forces are shaping the office market right now:
Submarket-by-Submarket Breakdown
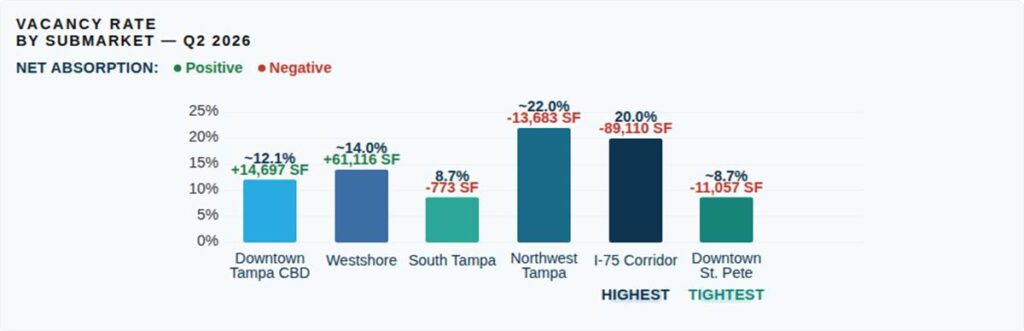
Vacancy and rates vary a lot depending on where you look. Here’s the Q2 2026 picture across Tampa Bay’s core submarkets:
| Submarket | Vacancy Rate | Net Absorption | Avg Asking Rate |
| Downtown Tampa CBD | ~12.1% | +14,697 SF | $39.30/SF |
| Westshore | ~14.0% | +61,116 SF | $38.38/SF |
| South Tampa | 8.7% | -773 SF | $37.51/SF* |
| Downtown St. Pete | ~8.7% (Tightest) | -11,057 SF | $44.00/SF |
| Northwest Tampa | ~22.0% | -13,683 SF | $24.71/SF |
| I-75 Corridor | 20.0% (Highest) | -89,110 SF | $25.54/SF* |
Urban cores continue to dramatically outperform suburban corridors — Downtown St. Pete is the tightest submarket in Tampa Bay, while I-75 Corridor carries the highest vacancy.
Let’s Talk Rent Numbers
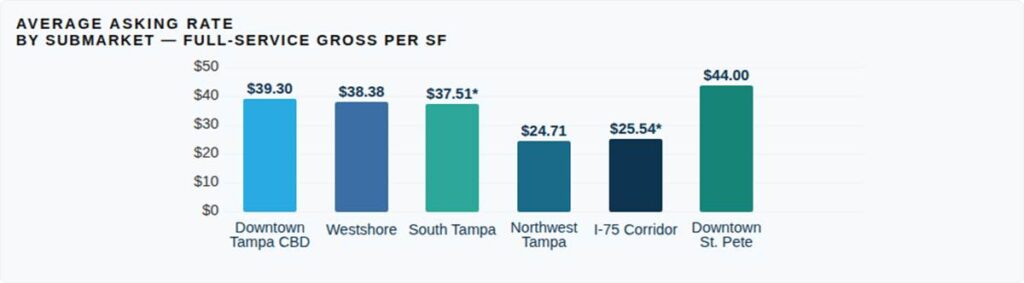
Class A rates are up 5.0% year-over-year, while Class B rates are down 1.4% year-over-year. The urban-suburban divide is stark, with core markets commanding rates 50–75% higher than suburban corridors.
| Submarket | Avg FS Rate | Class A FS Rate | Market Posture |
| Downtown Tampa CBD | $39.30/SF | $43.25/SF | Landlord Favorable |
| Westshore | $38.38/SF | $45.40/SF | Tightening |
| South Tampa | $37.51/SF* | $50.22/SF | Landlord Favorable |
| Downtown St. Petersburg | $44.00/SF | N/A | Landlord Favorable |
| Northwest Tampa | $24.71/SF | $28.46/SF | Tenant Favorable |
| I-75 Corridor | $25.54/SF* | $29.25/SF | Tenant Favorable |
Tampa Total Market — Historical Trend
| Quarter | Inventory SF | Total Vac% | Net Abs YTD | Avg FS Rate | Class A FS Rate |
| 2026 Q2 | 44,237,502 | 15.1% | +153,319 | $29.91 | $36.55 |
| 2026 Q1 | 44,237,502 | 16.2% | +132,941 | $29.81 | $35.78 |
| 2025 Q4 | 44,237,502 | 16.4% | +16,283 | $29.64 | $35.80 |
| 2025 Q3 | 44,237,502 | 16.3% | +46,342 | $29.45 | $34.94 |
| 2025 Q2 | 43,808,573 | 15.9% | +232,102 | $29.29 | $34.79 |
Significant Market Activity
Notable Leases This Quarter
- 5380 Tech Data Dr. (Bay Vista Pavillion) — RomTech, 50,013 SF, Direct, Bayside
- 10441 University Center Dr. (University Center II) — Eagle Analytical Services, 48,090 SF, Direct, I-75 Corridor
- 18302 Highwoods Preserve Pky. (Burns & Wilcox Center) — Depository Trust & Clearing Corp., 32,203 SF, Renewal, I-75 Corridor
- 200 Central Ave (200 Central) — Kimley-Horn, 24,272 SF, Direct, Downtown St. Pete
- 8800 Grand Oak Cir. (Hidden River Corp. Ctr. One) — The Coca-Cola Company, 24,165 SF, Direct, I-75 Corridor
Notable Sales This Quarter
- 400 N. Ashley Dr. (Rivergate Tower) — 500,000 SF, purchased by Ally Capital Group, Downtown Tampa CBD
- 311 Park Place Blvd. — 118,447 SF, purchased by Joseph A. Kennedy, Bayside
- 13101 Telecom Dr. (Oakview Center) — 79,393 SF, purchased by USF Federal Credit Union, I-75 Corridor
New Construction Pipeline
Zero new groundbreakings for four consecutive quarters. With only ~122K SF under construction on average across both sources — approximately 0.1–0.2% of total inventory — this is the thinnest pipeline in over a decade.
- E2 — Grow Financial Place (Ybor City): 94,130–106,338 SF, Delivering Q2. The only active project underway; Grow Financial’s new HQ.
- Downtown Tampa CBD Pipeline: 94,000 SF under construction.
- Downtown St. Pete Pipeline: 44,000 SF under construction.
- Midtown East (Westshore): 131,790 SF, delivered 2025. Tampa’s first new Class A building since 2021, and already near fully leased.
What This Means for You
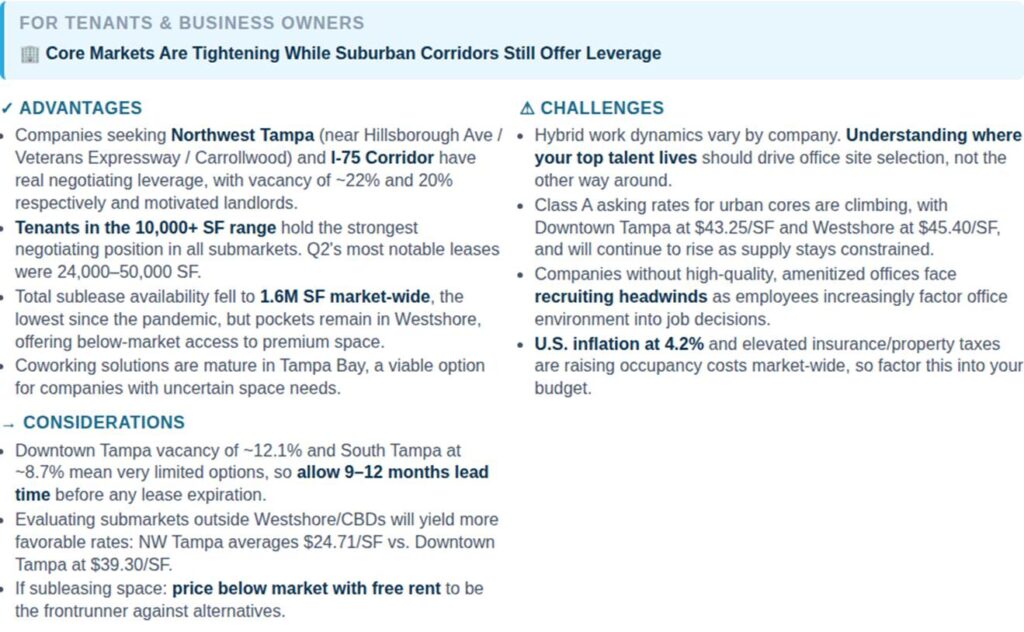
For Tenants & Business Owners
For Landlords & Property Owners
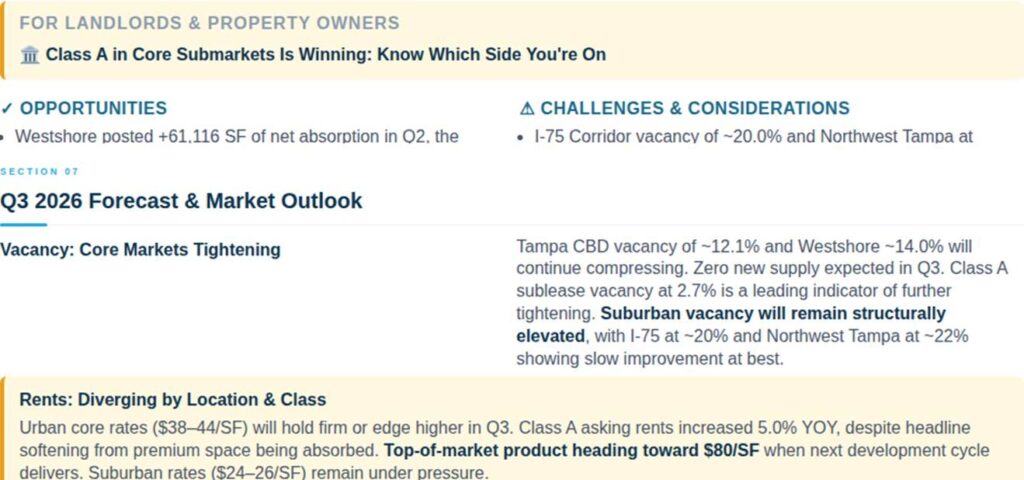
Q3 2026 Forecast & Market Outlook
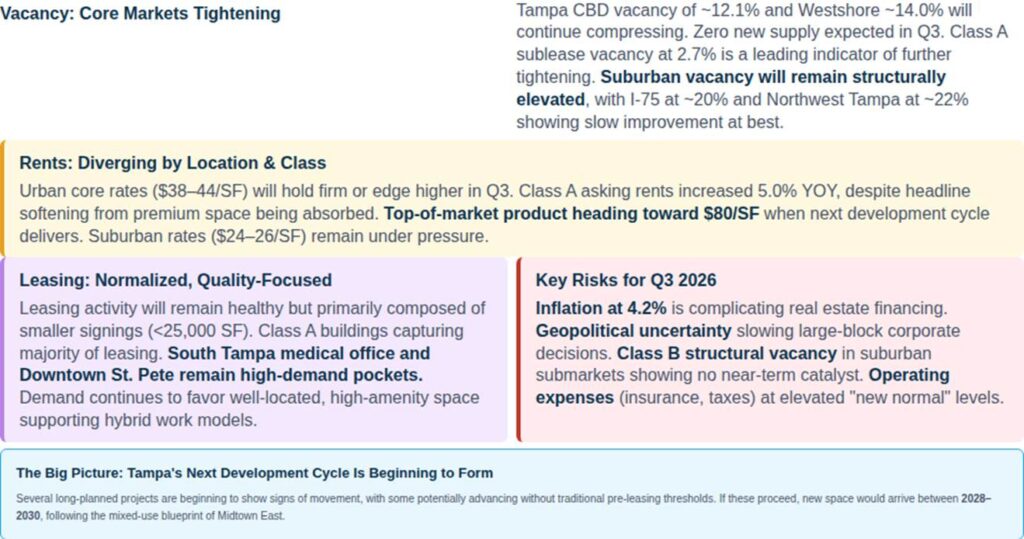
OSB Q3 2026 Forecast Summary
| Indicator | Q2 2026 | Q3 2026 Forecast | Direction | Confidence |
| Overall Vacancy | ~17.6% | ~17.0–17.5% | Slight Improvement | Moderate |
| Downtown Tampa Vacancy (Avg) | ~12.1% | ~11.0–12.5% | Tightening | Moderate-High |
| Westshore Vacancy (Avg) | ~14.0% | ~13.0–14.5% | Tightening | Moderate-High |
| I-75 Corridor Vacancy | ~20.0% | Elevated / Slow Improvement | Structural | High |
| Avg Asking Rate | $30.38/SF | $31.15/SF | Stable to Rising | Moderate |
| Class A Rate | $38.77/SF | $39.25/SF | Increasing | Moderate-High |
| Net Absorption (Avg) | ~-72K SF | Modest Positive to Neutral | Improving | Moderate |
| Under Construction | ~122K SF | No New Starts Expected | Constrained | High |
| Top-of-Market Rents | >$75/SF Full Service | $79/SF Full Service | Sustained | High |
| Future Pipeline (2028–2030) | Early Movement Signals | Watch for Announcements | Forming | Low-Moderate |
Data sources: Market data sourced from believed to be accurate sources. Economic data: FloridaCommerce; U.S. Bureau of Labor Statistics. This report was prepared by Office Space Brokers for informational purposes only and does not constitute legal, financial, or investment advice. Forward-looking statements represent OSB professional opinion and are not guarantees of future performance. © 2026 Office Space Brokers. All rights reserved.