Important Highlights:
Tampa Bay:
- Office vacancy rates in Tampa are around 13.4% for all over class buildings
- The unemployment rate in Tampa Bay has decreased to 3.50% in January 2022, compared to the end of the 4th Quarter 2021, which was approx. 4.8%. Compared to the national average which is 3.6%
- Tampa Bay is third in the nation among the fastest-growing metropolitan areas for entrepreneurs
Office Market:
- As everyone is still recovering from the pandemic, more companies are continuing to make decisions of going back to office full time, testing flex working schedules and making their office space decisions of relocating, expanding or consolidating their office if their lease is ending in 2022.
- Despite the fact that there was a substantial amount of sublease space on the market, absorption in Q4 2021 was positive, this was mostly due to the smaller block sublease space being leased by Tenants with short lead times and/or new companies moving into the Tampa market.
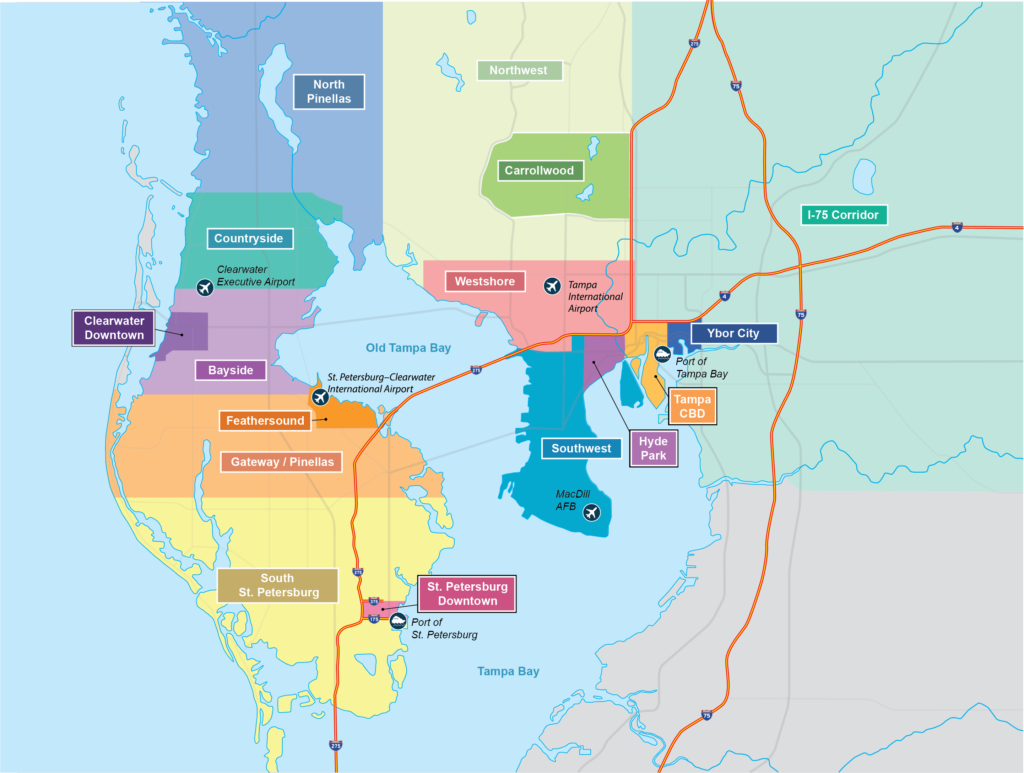
- The most significant activity was for office spaces Downtown Tampa and secondly in Westshore for 1,000 SF-5,000 SF spaces. Companies have delayed their decisions with relocating their offices as they continue to maneuver the changing of their office environment, leaving short time frames before leases end. Landlords who have move-in ready spaces experienced a competitive advantage to capture Tenants who had quick timelines for identifying a new office before their current lease ends.
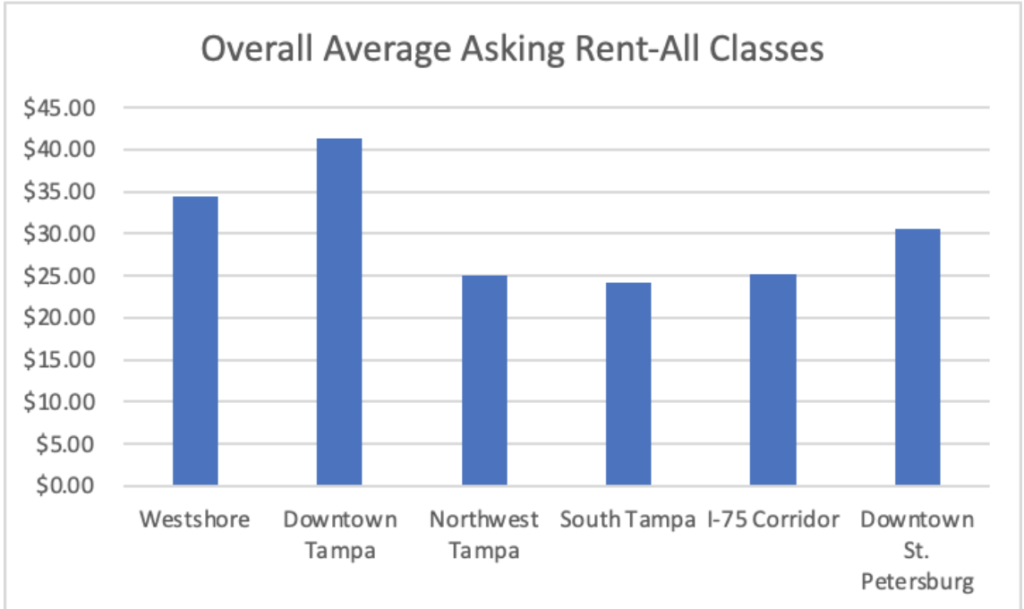
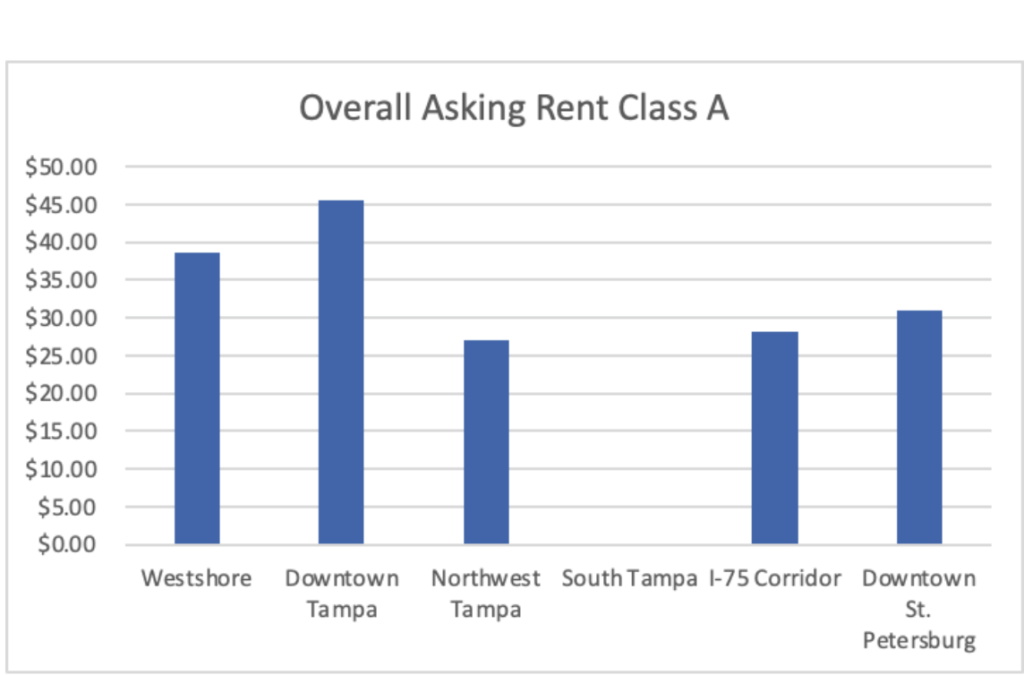
Let’s Talk Rent Numbers:
| Submarket | Overall Average Asking Rent-All Classes | Overall Asking Rent Class A |
| Westshore | $34.15 Sq. Ft. | $37.99 Sq. Ft. |
| Downtown Tampa | $36.31 Sq. Ft. | $37.98 Sq. Ft. |
| Northwest Tampa | $24.12 Sq. Ft. | $26.96 Sq. Ft. |
| South Tampa | $27.48 Sq. Ft. | N/A |
| I-75 Corridor | $25.26 Sq. Ft. | $28.06 Sq. Ft. |
| Downtown St. Petersburg | $30.89 Sq. Ft. | $31.76 Sq. Ft. |
Construction Highlights:
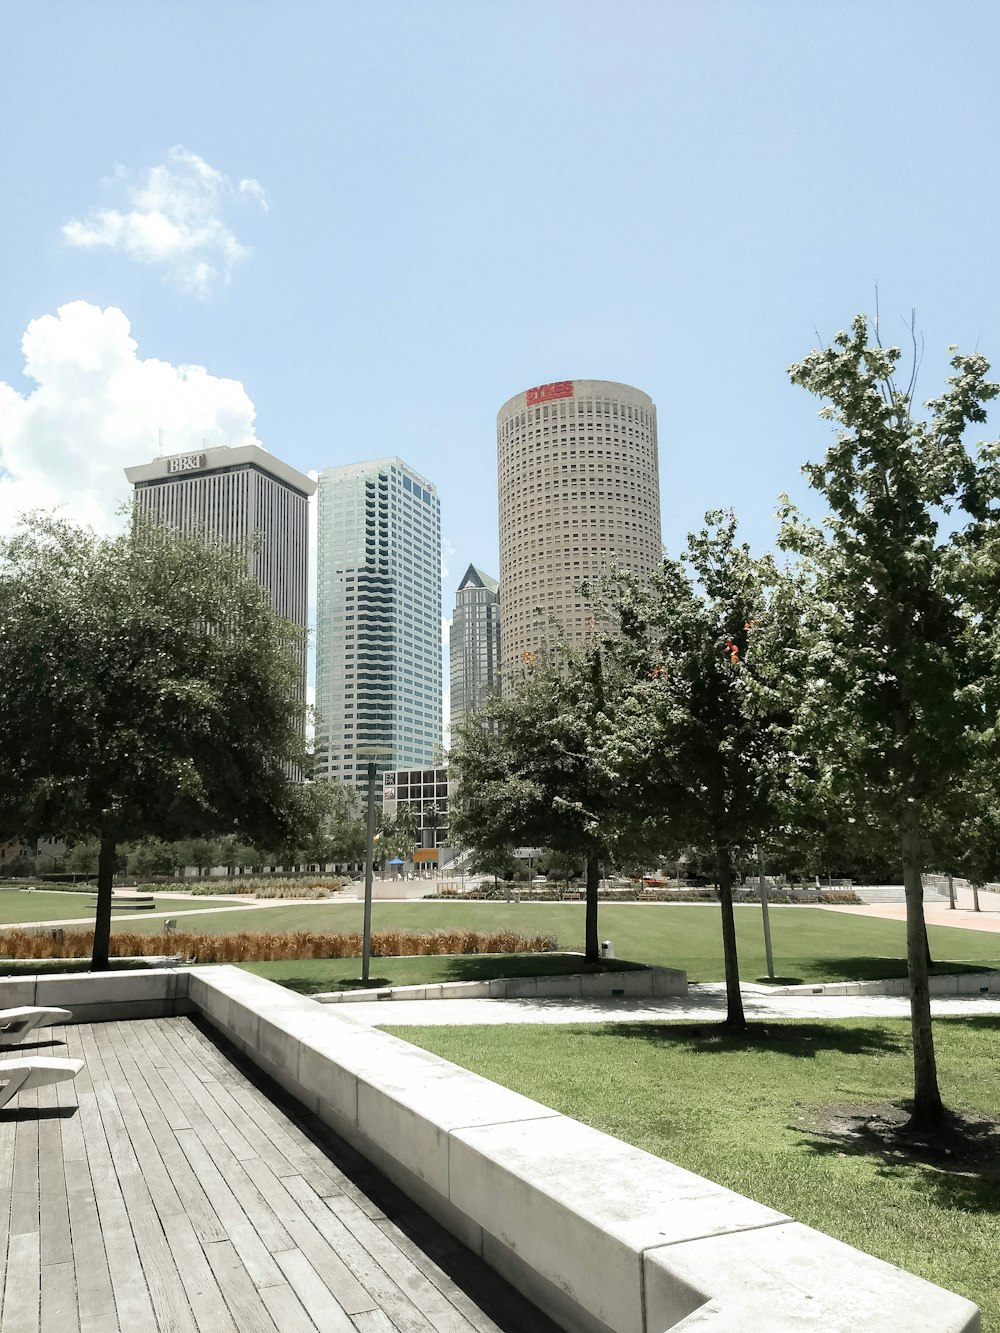
- In Hillsborough County, there is new construction at 1001 Water Street in the Central Business District (CBD), Midtown Two in Westshore, and an office building in the University of South Florida Research Park in the Northwest submarket. These are expected to be delivered by the end of the year. About 900,000 SF of new construction coming to the market by 2022.
2022 2nd Quarter Forecast:
- As new construction underway is projected to be completed by the end of the year, total vacancy is expected to climb with the increase of available space coming to market.
- Flex schedules will continue to be experimented with a combination of working from home and in the office. Companies who have delayed their relocation and expansion decisions, may experience limited available options and lose leverage when negotiating when facing such short timeframes.
- Companies from out of state will continue to expand and relocate to Tampa Bay because of our business-friendly atmosphere and Tampa Bay was voted the number one sports city in 2021. Click here to read more about why so many businesses are moving to Tampa.
What does this mean for Tenants?
- Vacancy rates do not comparable to other key markets in the US, despite Landlords being more liberal with lease economics. Landlords in Tampa Bay are not motivated in the same way that they are in other parts of the country to replace vacancies.
- Tenants can leverage market circumstances to their advantage.
- companies need to examine their current work environment and engage in employee feedback. Feedback will bring clarity to their developing office space culture and the role it plays in the overall health of their company.
What does this mean for Landlords?
- Demand for new leases increased by 8.0 percent in the first quarter of 2022. More out-of-state tenants are still expanding in the market and migrating to Tampa Bay.
- Adjusting the asking rent to gain a competitive edge against Landlords who must keep their face prices.
- Provide more flexible lease terms and discounts, such as a rent reduction.
- Start promoting available space 6 months in advance.